The reproduction of the figures found on this page is authorized free of charge and without formal written permission provided that the original source is properly acknowledged and the figures are replicated without modification, including the full legend.
The reproduced graphic should include the complete caption provided that the source is acknowledged.
Should users require higher resolution graphics, please send an email to [email protected], referencing the figure number in question in the subject line, and a member of the WGIII Technical Support Unit will respond to your request.
|
|---|
|
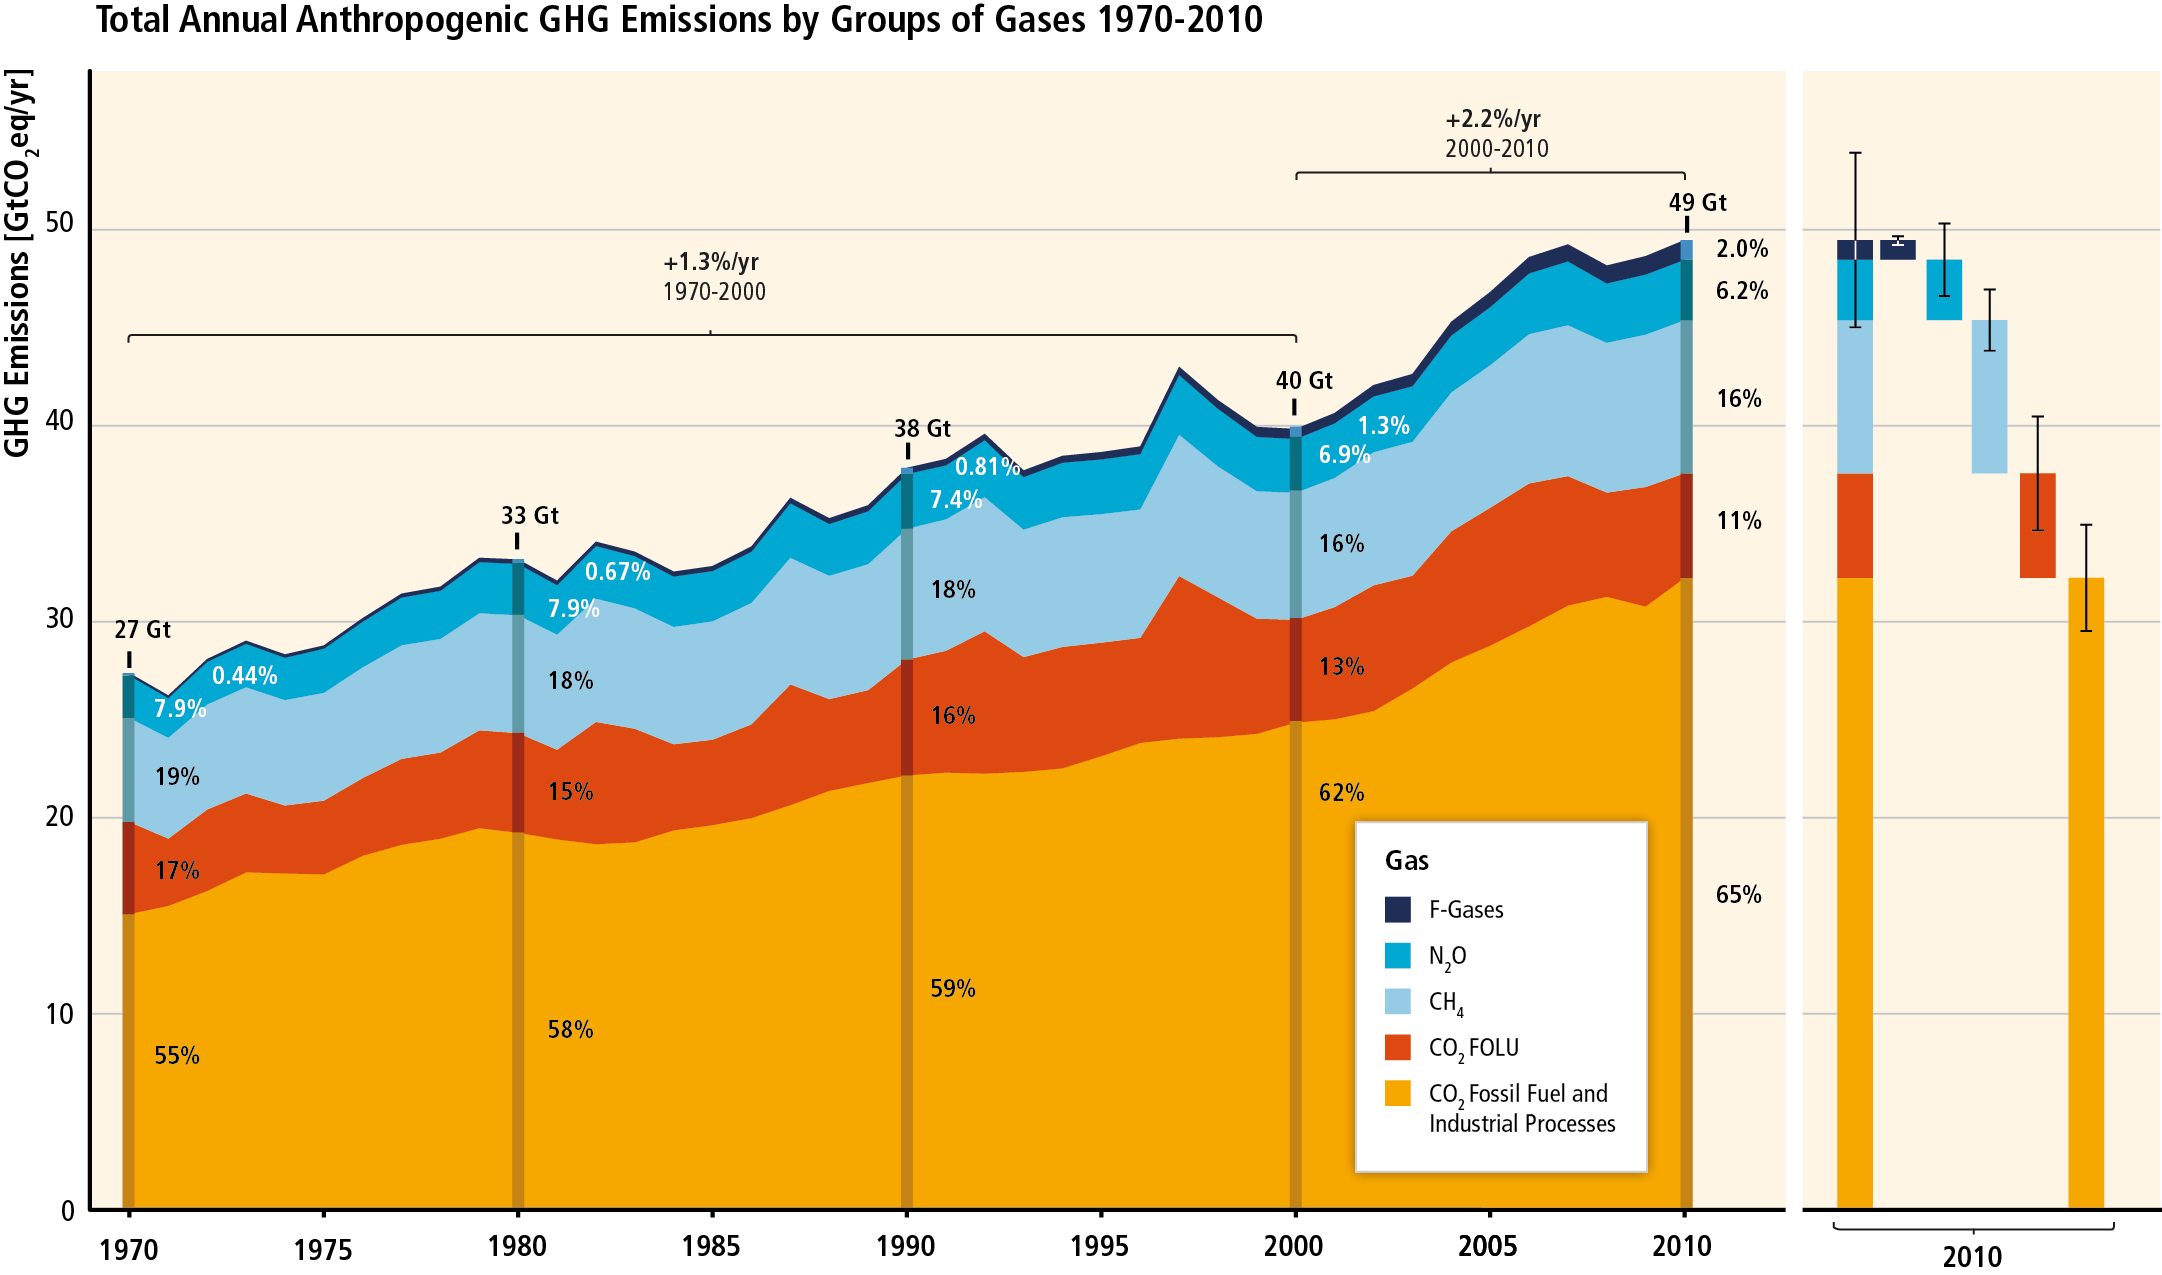 Figure SPM.1: Figure SPM.1:
Download PDF (vector)
Total annual anthropogenic GHG emissions (GtCO2eq/yr) by groups of gases 1970-2010: CO2 from fossil fuel combustion and industrial processes; CO2 from Forestry and Other Land Use (FOLU); methane (CH4); nitrous oxide (N2O); fluorinated gases8 covered under the Kyoto Protocol (F-gases). At the right side of the figure GHG emissions in 2010 are shown again broken down into these components with the associated uncertainties (90% confidence interval) indicated by the error bars. Total anthropogenic GHG emissions uncertainties are derived from the individual gas estimates as described in Chapter 5 [5.2.3.6]. Global CO2 emissions from fossil fuel combustion are known within 8% uncertainty (90% confidence interval). CO2 emissions from FOLU have very large uncertainties attached in the order of ±50%. Uncertainty for global emissions of CH4, N2O and the Fgases has been estimated as 20%, 60% and 20%, respectively. 2010 was the most recent year for which emission statistics on all gases as well as assessment of uncertainties were essentially complete at the time of data cut off for this report. Emissions are converted into CO2-equivalents based on GWP100 6 from the IPCC Second Assessment Report. The emission data from FOLU represents land-based CO2 emissions from forest fires, peat fires and peat decay that approximate to net CO2 flux from the FOLU as described in chapter 11 of this report. Average annual growth rate over different periods is highlighted with the brackets. [Figure 1.3, Figure TS.1] [Subject to final quality check and copy edit.]
|
|
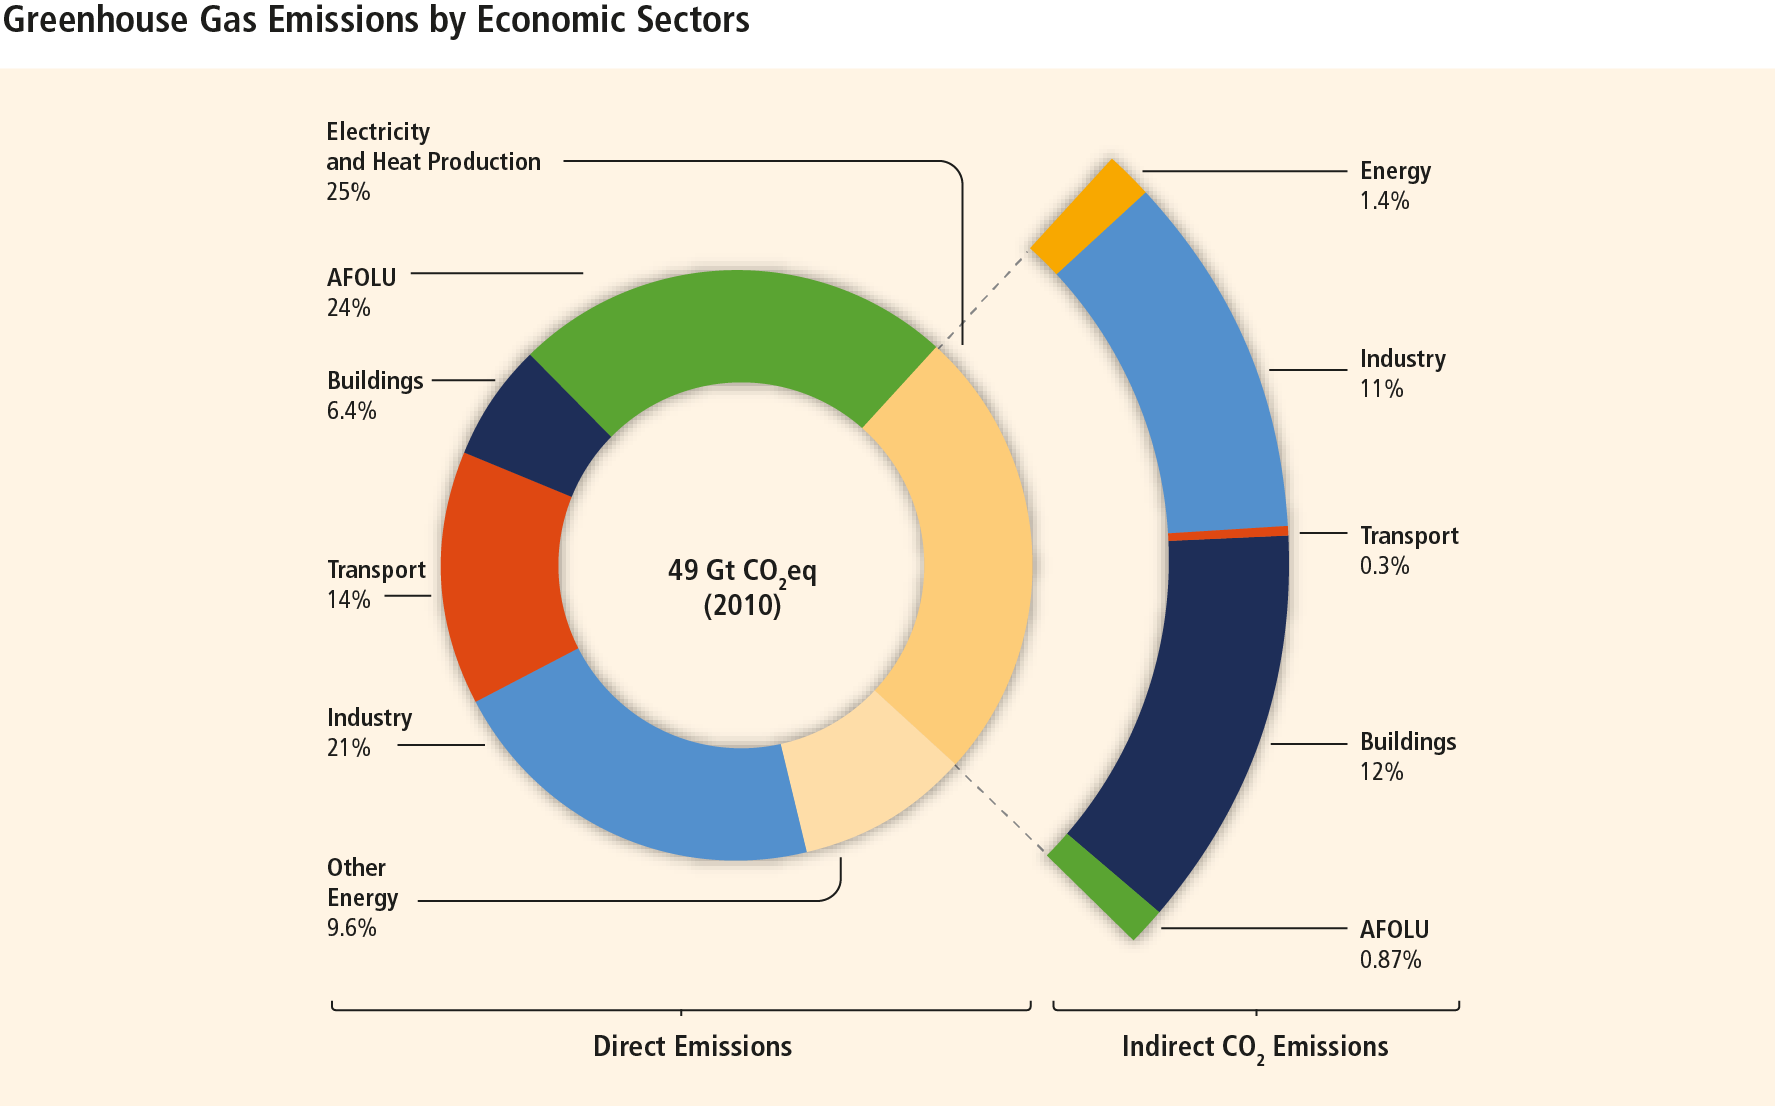 Figure SPM.2: Figure SPM.2:
Download PDF (vector)
Total anthropogenic GHG emissions (GtCO2eq/yr) by economic sectors. Inner circle shows direct GHG emission shares (in % of total anthropogenic GHG emissions) of five economic sectors in 2010. Pull-out shows how indirect CO2 emission shares (in % of total anthropogenic GHG emissions) from electricity and heat production are attributed to sectors of final energy use. “Other Energy” refers to all GHG emission sources in the energy sector as defined in Annex II other than electricity and heat production [A.II.9.1]. The emissions data from Agriculture, Forestry and Other Land Use (AFOLU) includes land-based CO2 emissions from forest fires, peat fires and peat decay that approximate to net CO2 flux from the Forestry and Other Land Use (FOLU) sub-sector as described in Chapter 11 of this report. Emissions are converted into CO2-equivalents based on GWP100 from the IPCC Second Assessment Report. Sector definitions are provided in Annex II.9. [Figure 1.3a, Figure TS.3 a/b] [Subject to final quality check and copy edit.]
|
|
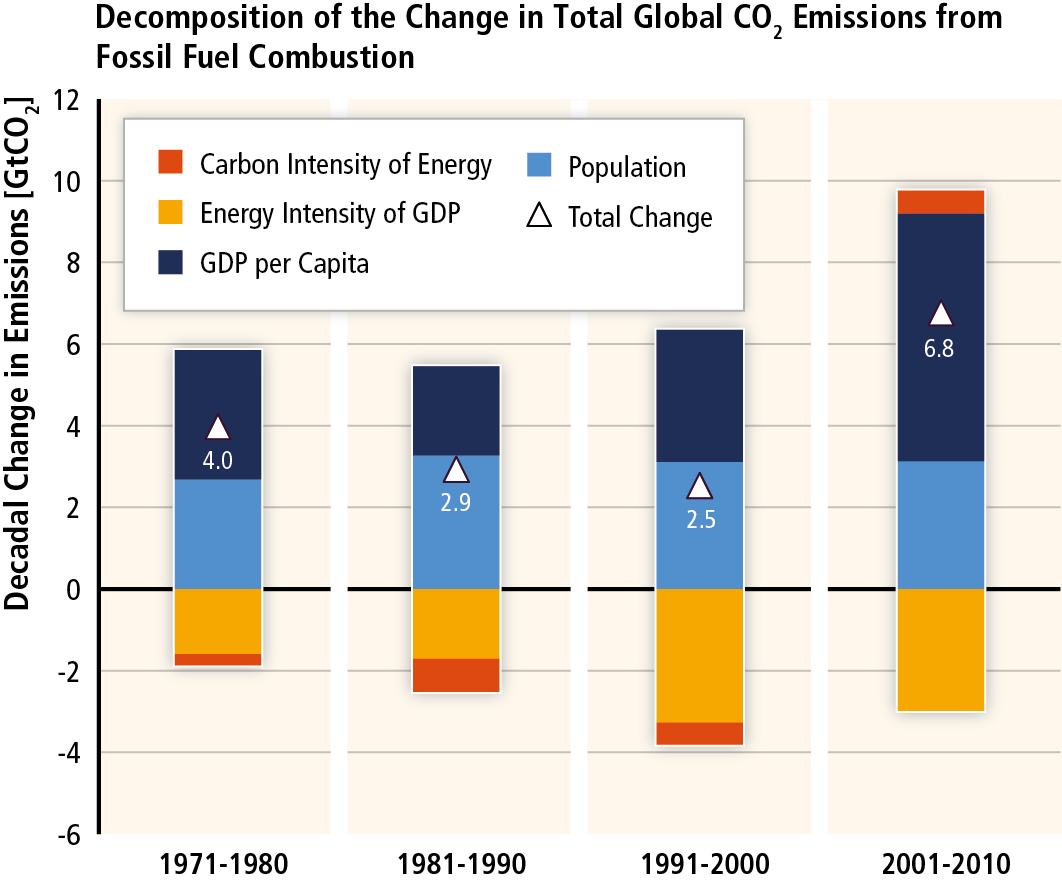 Figure SPM.3: Figure SPM.3:
Download PDF (vector)
Decomposition of the decadal change in total global CO2 emissions from fossil fuel combustion by four driving factors; population, income (GDP) per capita, energy intensity of GDP and carbon intensity of energy. The bar segments show the changes associated with each factor alone, holding the respective other factors constant. Total decadal changes are indicated by a triangle. Changes are measured in giga tonnes (Gt) of CO2 emissions per decade; income is converted into common units using purchasing power parities. [Figure 1.7] [Subject to final quality check and copy edit.]
|
|
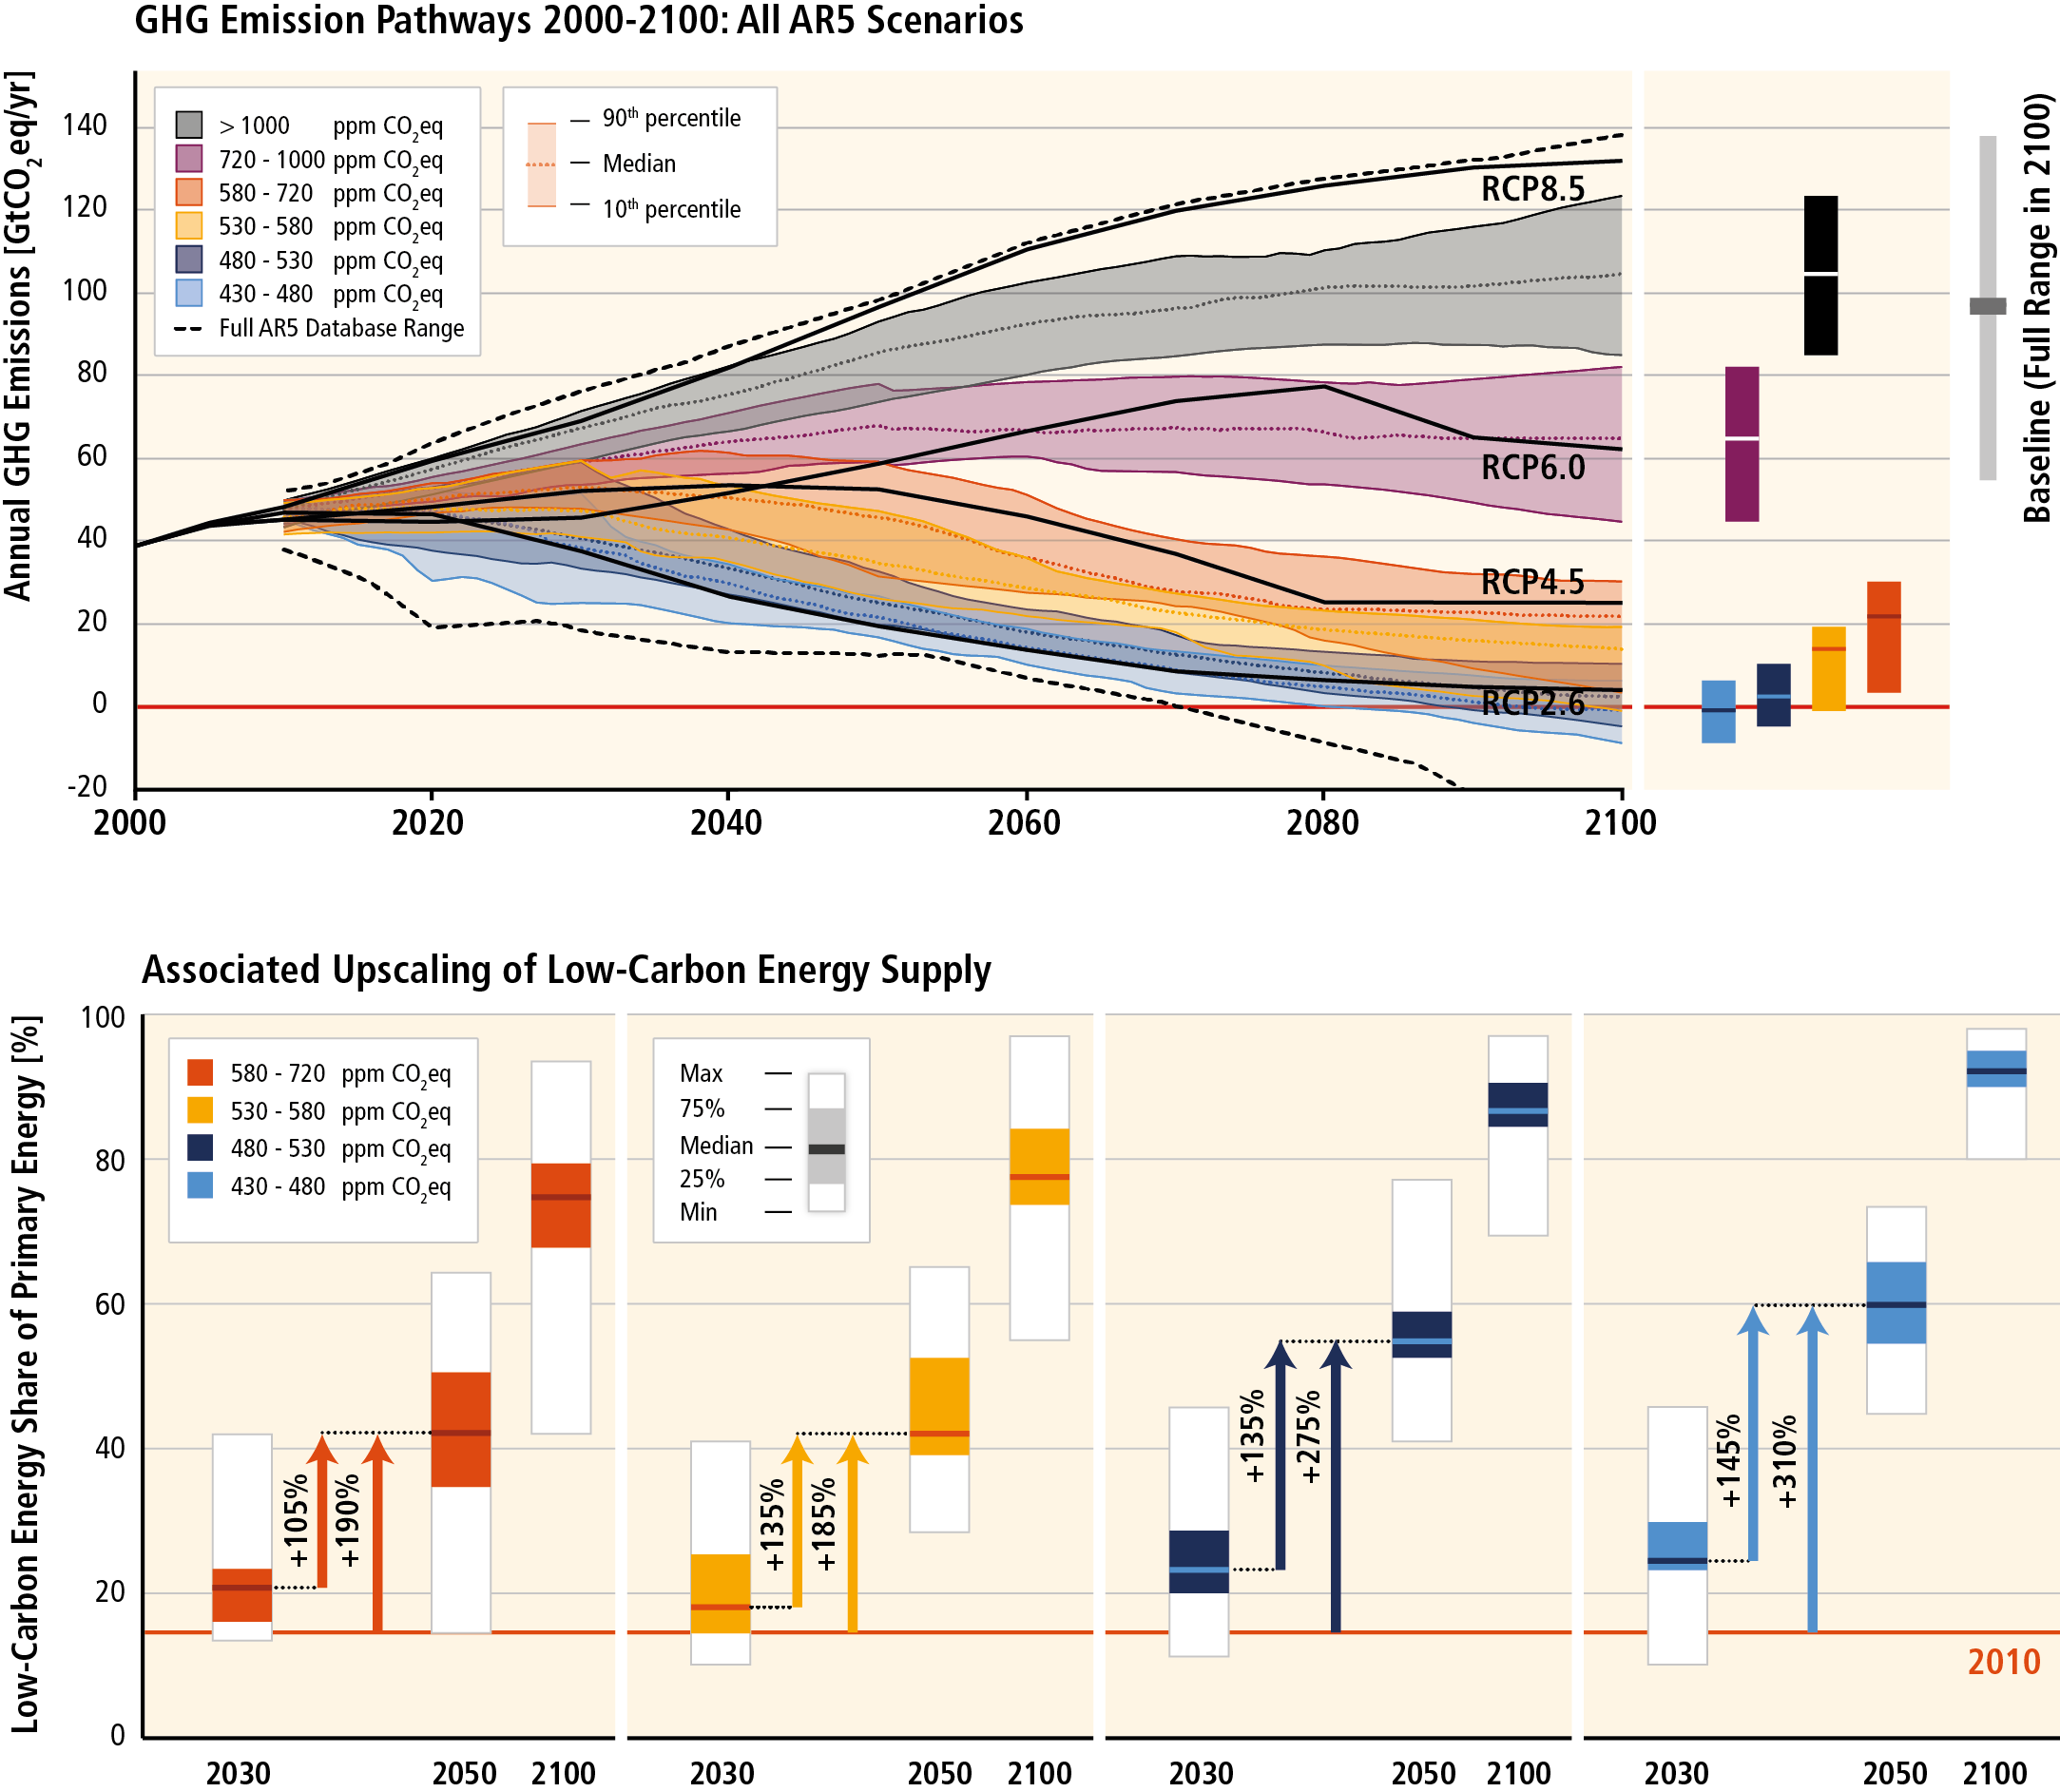 Figure SPM.4: Figure SPM.4:
Download PDF (vector)
Pathways of global GHG emissions (GtCO2eq/yr) in baseline and mitigation scenarios for different long-term concentration levels (upper panel) and associated upscaling requirements of low-carbon energy (% of primary energy) for 2030, 2050 and 2100 compared to 2010 levels in mitigation scenarios (lower panel). The upper and lower panels exclude scenarios with limited technology availability and the lower panel in addition excludes scenarios that assume exogenous carbon price trajectories. [Figure 6.7, Figure 7.16] [Subject to final quality check and copy edit.]
|
|
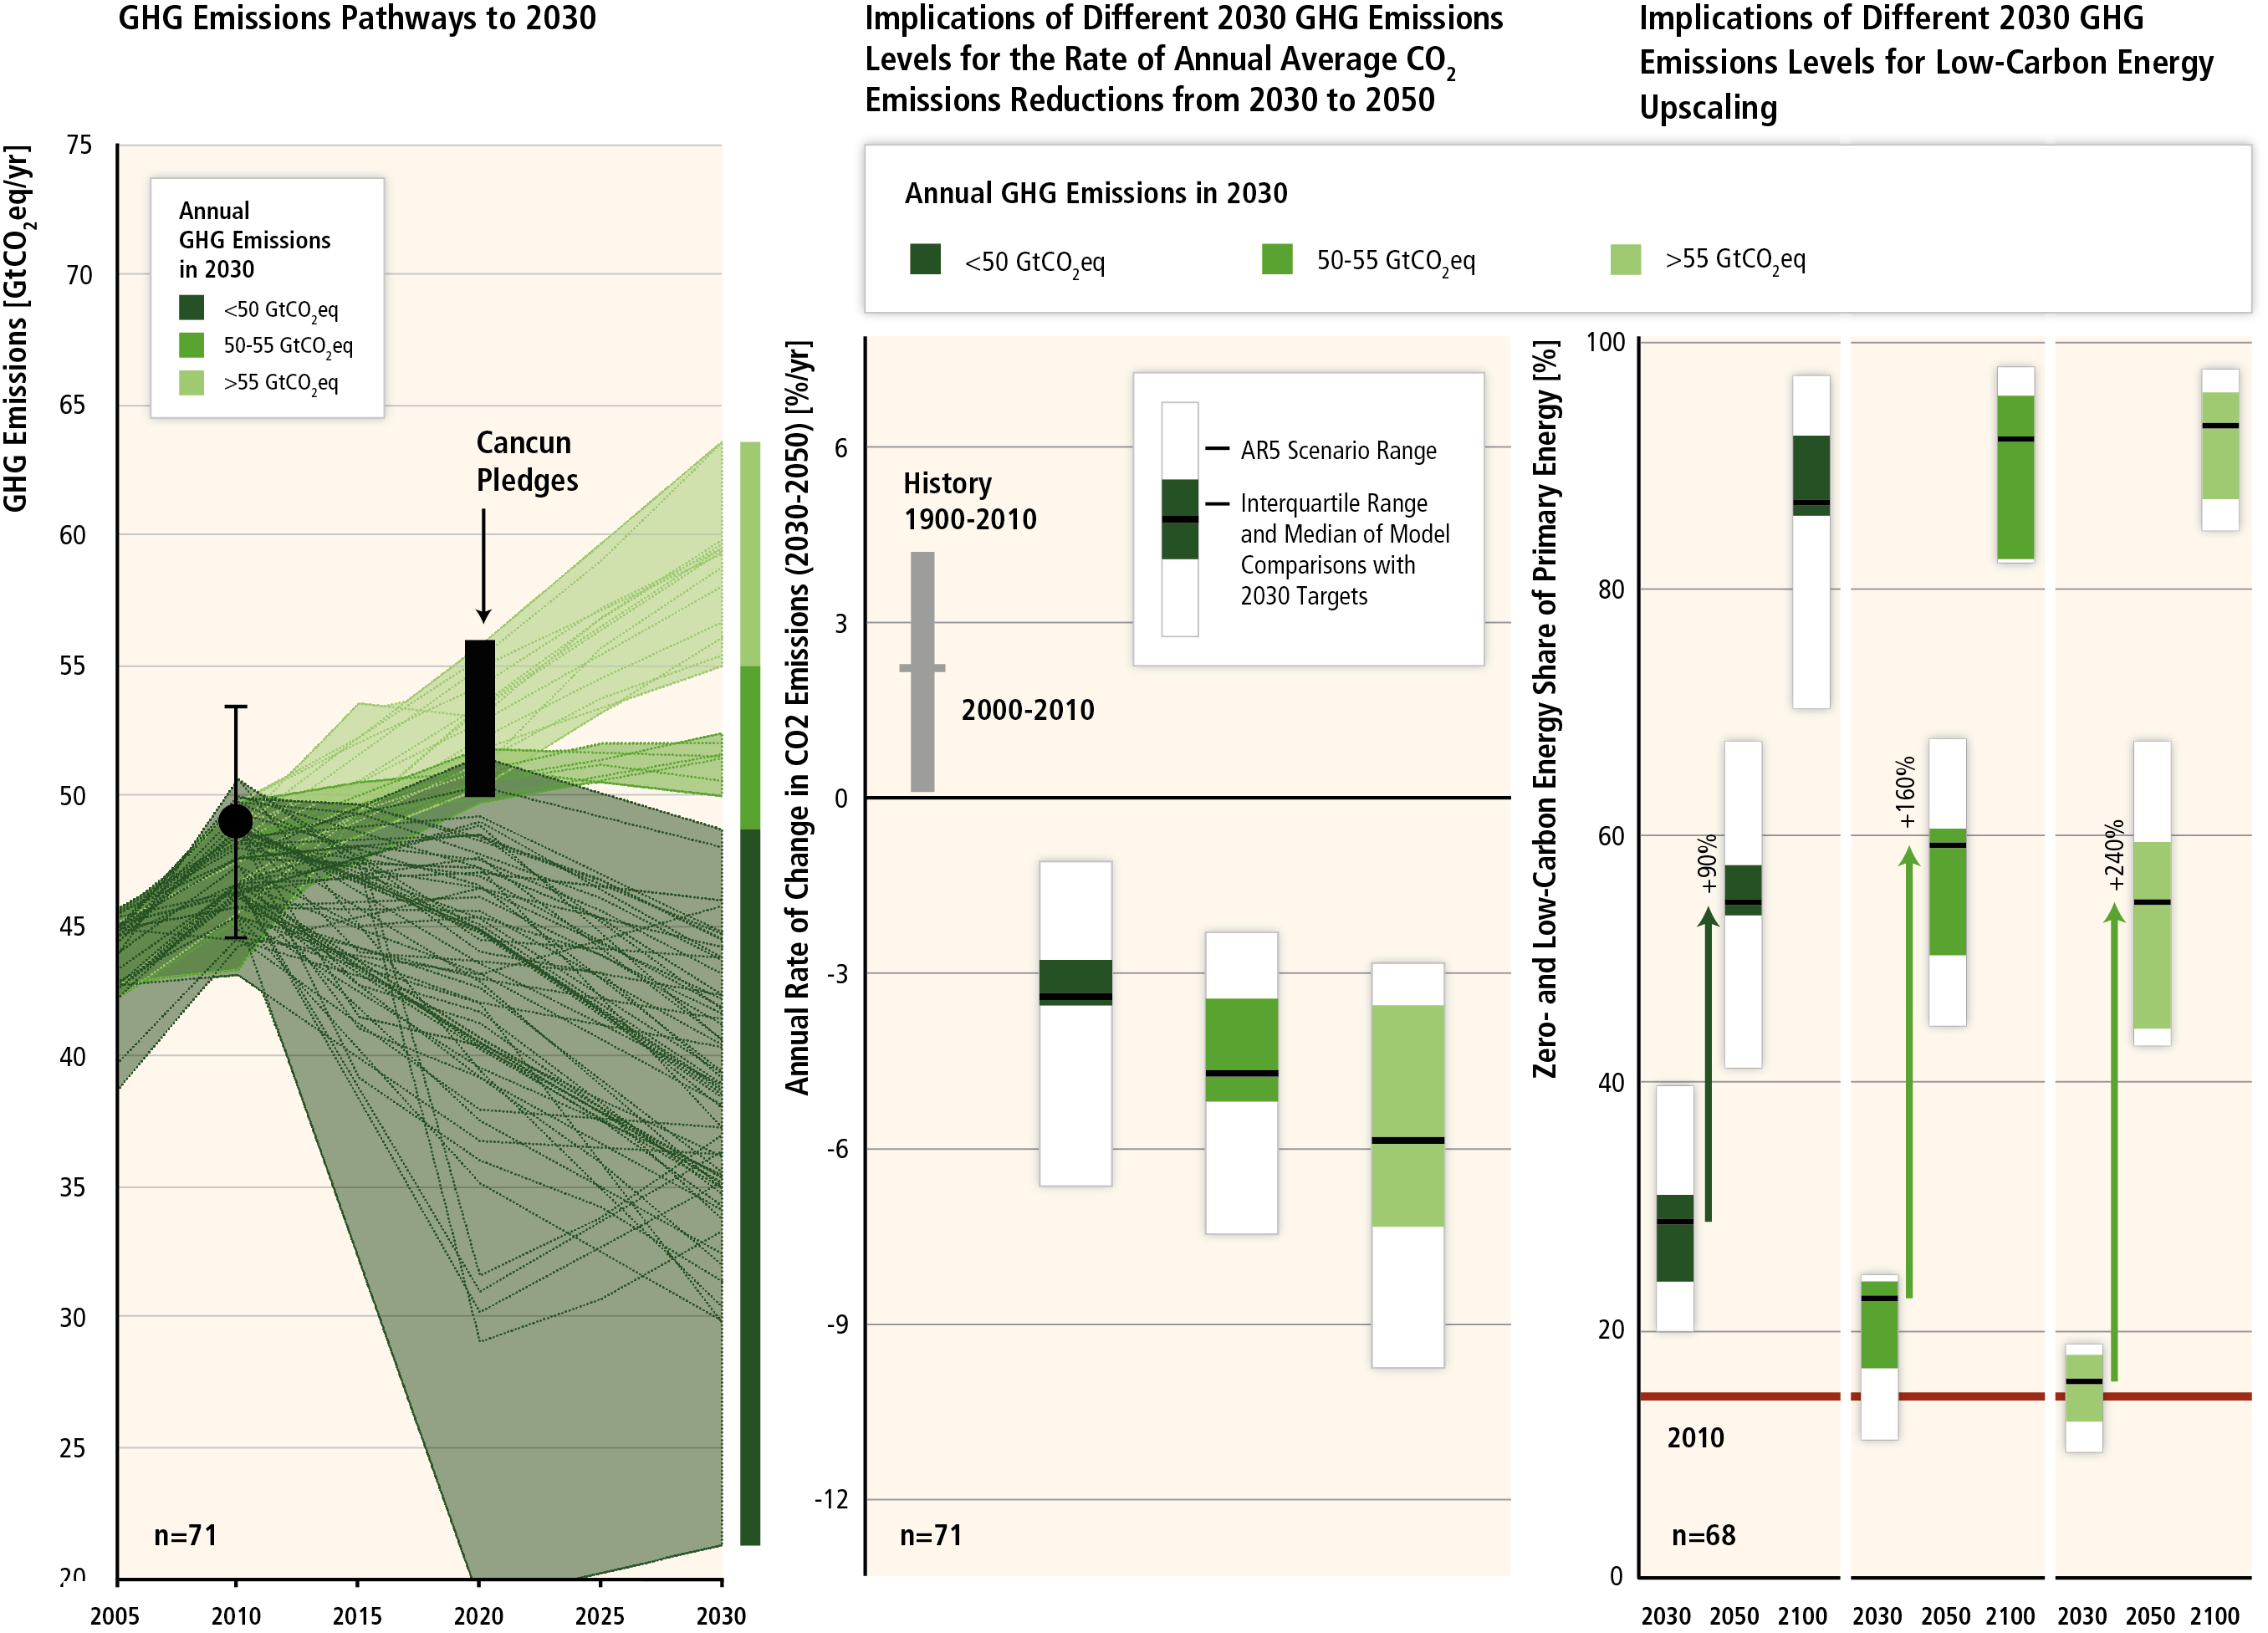 Figure SPM.5: Figure SPM.5:
Download PDF (vector)
The implications of different 2030 GHG emissions levels for the rate of CO2 emissions reductions and low-carbon energy upscaling from 2030 to 2050 in mitigation scenarios reaching about 450 to 500 (430–530) ppm CO2eq concentrations by 2100. The scenarios are grouped according to different emissions levels by 2030 (coloured in different shades of green). The left panel shows the pathways of GHG emissions (GtCO2eq/yr) leading to these 2030 levels. The black bar shows the estimated uncertainty range of GHG emissions implied by the Cancún Pledges. The middle panel denotes the average annual CO2 emissions reduction rates for the period 2030–2050. It compares the median and interquartile range across scenarios from recent intermodel comparisons with explicit 2030 interim goals to the range of scenarios in the Scenario Database for WGIII AR5. Annual rates of historical emissions change (sustained over a period of 20 years) are shown in grey. The arrows in the right panel show the magnitude of zero and low-carbon energy supply up-scaling from 2030 to 2050 subject to different 2030 GHG emissions levels. Zero- and low-carbon energy supply includes renewables, nuclear energy and fossil energy with carbon dioxide capture and storage (CCS), or bioenergy with CCS (BECCS). Note: Only scenarios that 1 apply the full, unconstrained mitigation technology portfolio of the underlying models (default technology assumption) are shown. Scenarios with large net negative global emissions (>20 GtCO2eq/yr), scenarios with exogenous carbon price assumptions, and scenarios with 2010 emissions significantly outside the historical range are excluded. [Figure 6.32, 7.16] [Subject to final quality check and copy edit.]
|
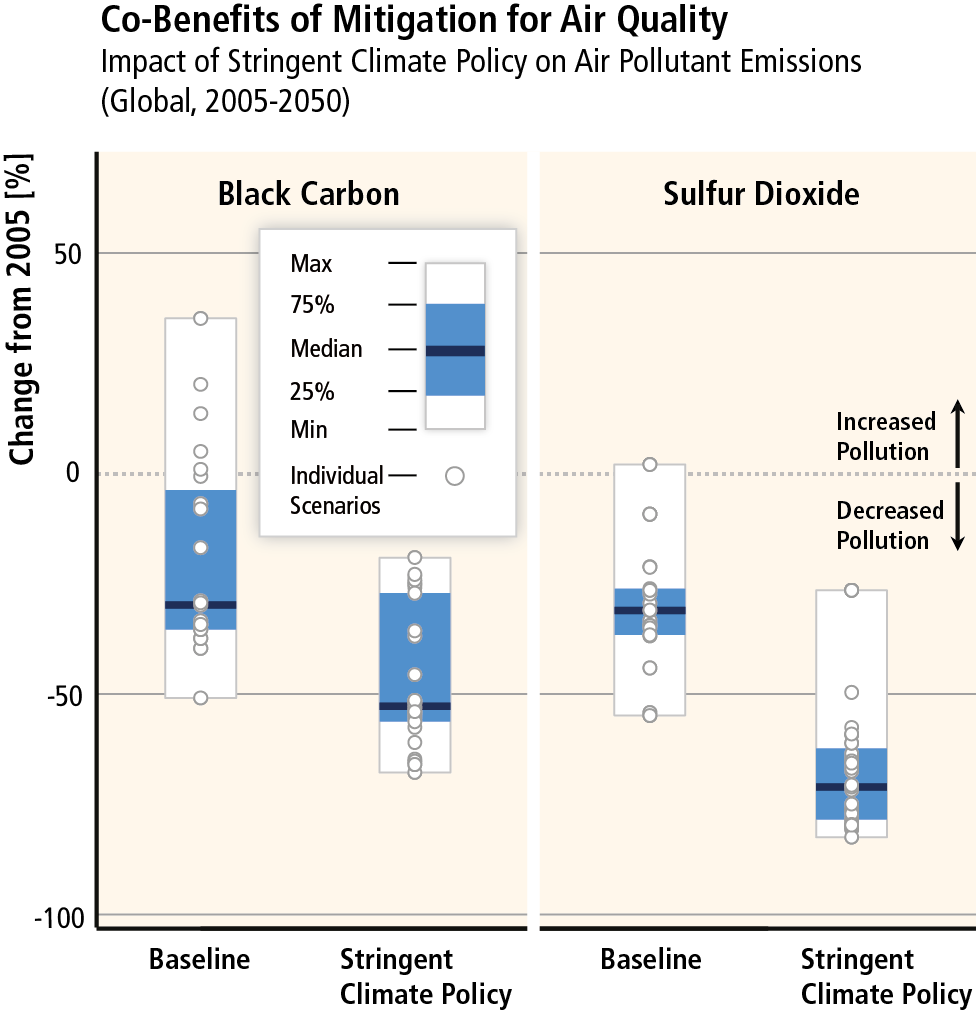
Figure SPM.6:
Download PDF (vector)
Air pollutant emission levels for black carbon (BC) and sulfur dioxide (SO2) in 2050 relative to 2005 (0=2005 levels). Baseline scenarios without additional efforts to reduce GHG emissions beyond those in place today are compared to scenarios with stringent mitigation policies, which are consistent with reaching atmospheric CO2eq concentration levels between 430 and 530 ppm CO2eq by 2100. [Figure 6.33] [Subject to final quality check and copy edit.]
|
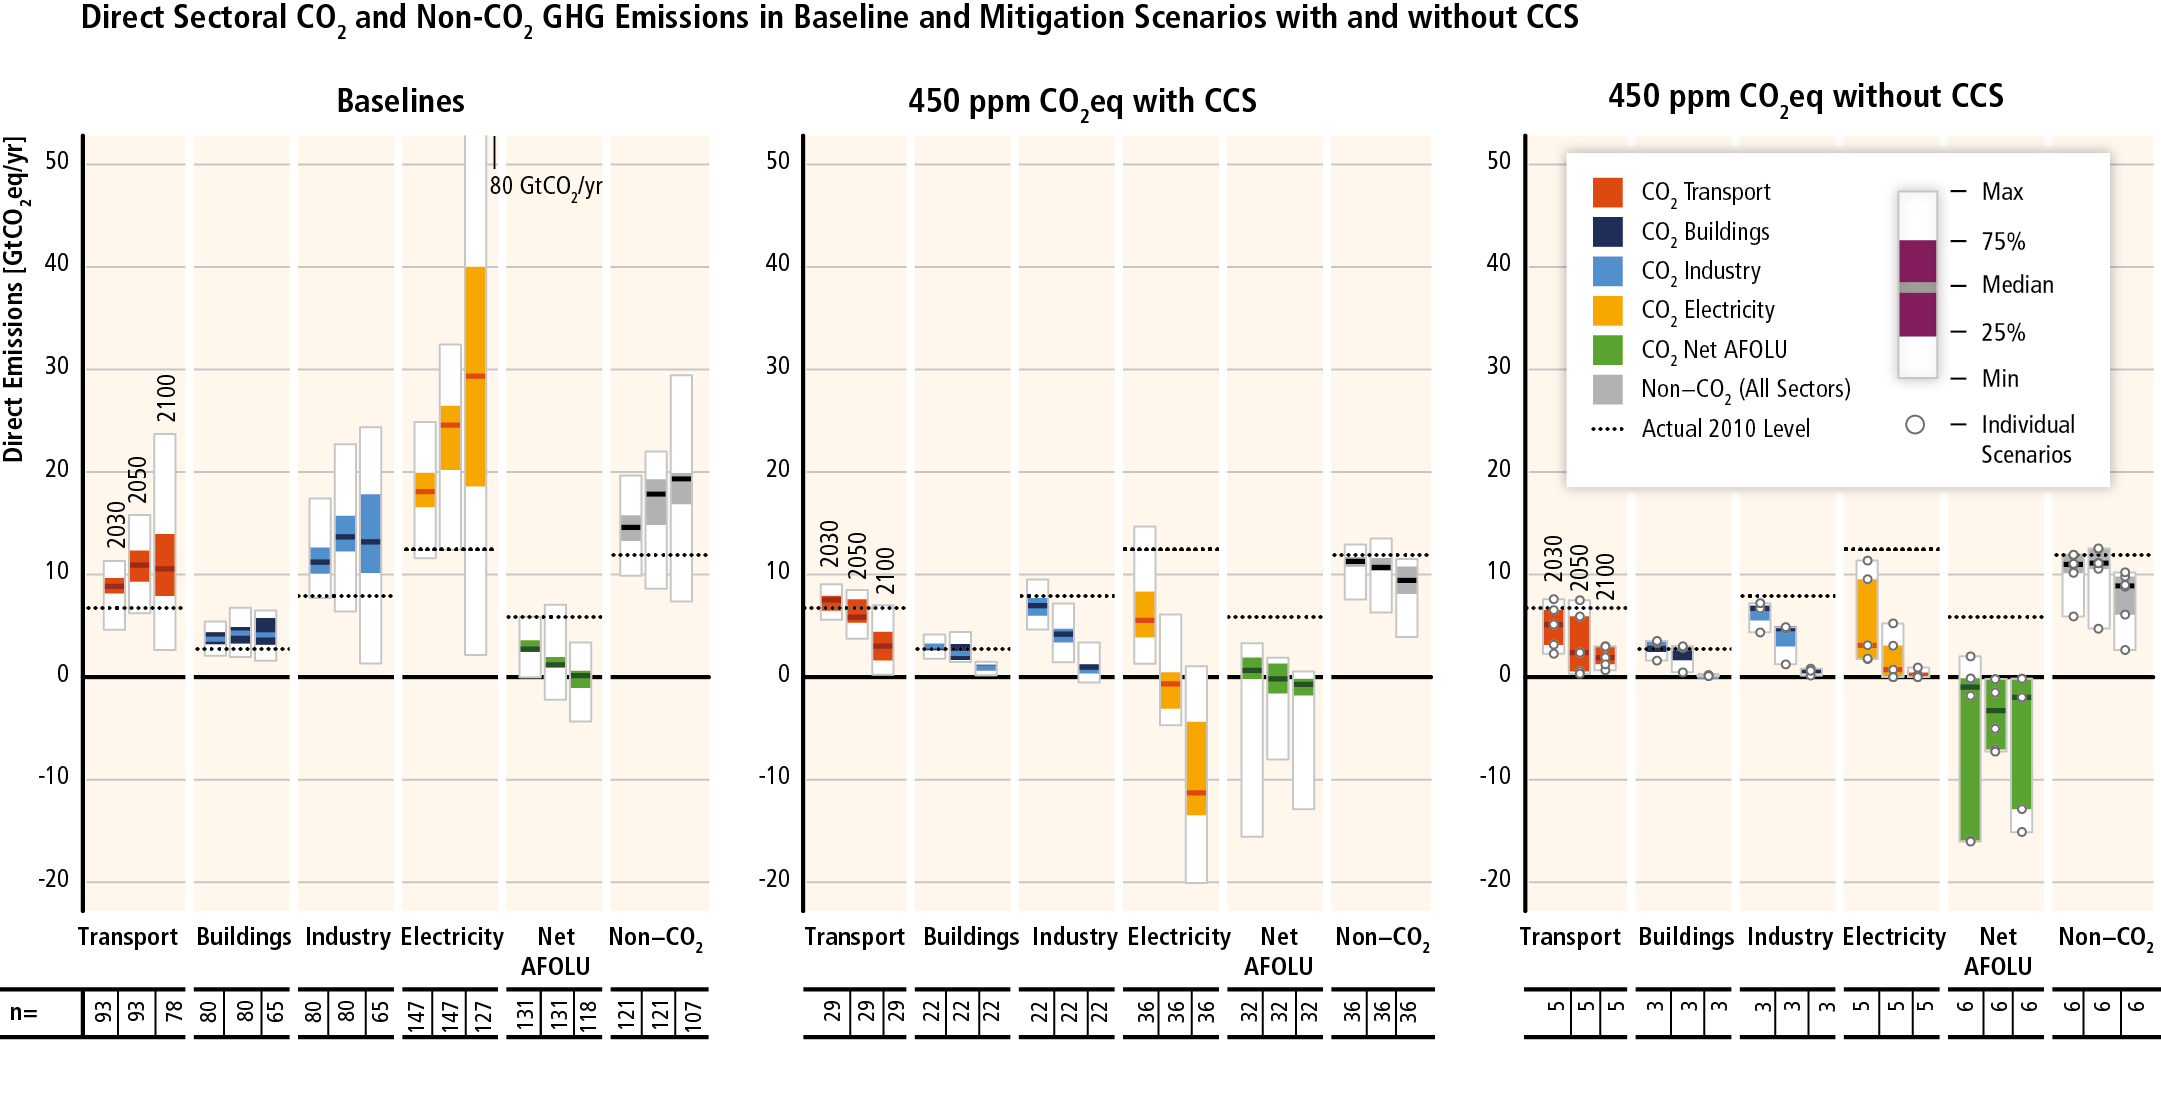
Figure SPM.7.
Download PDF (vector)
Direct emissions of CO2 by sector and total non-CO2 GHGs (Kyoto gases) across sectors in baseline (left panel) and mitigation scenarios that reach around 450 (430–480) ppm CO2eq with CCS (middle panel) and without CCS (right panel). The numbers at the bottom of the graphs refer to the number of scenarios included in the range which differs across sectors and time due to different sectoral resolution and time horizon of models. Note that many models cannot reach 450 ppm CO2eq concentration by 2100 in the absence of CCS, resulting in a low number of scenarios for the right panel [Figures 6.34 and 6.35]. [Subject to final quality check and copy edit.
|
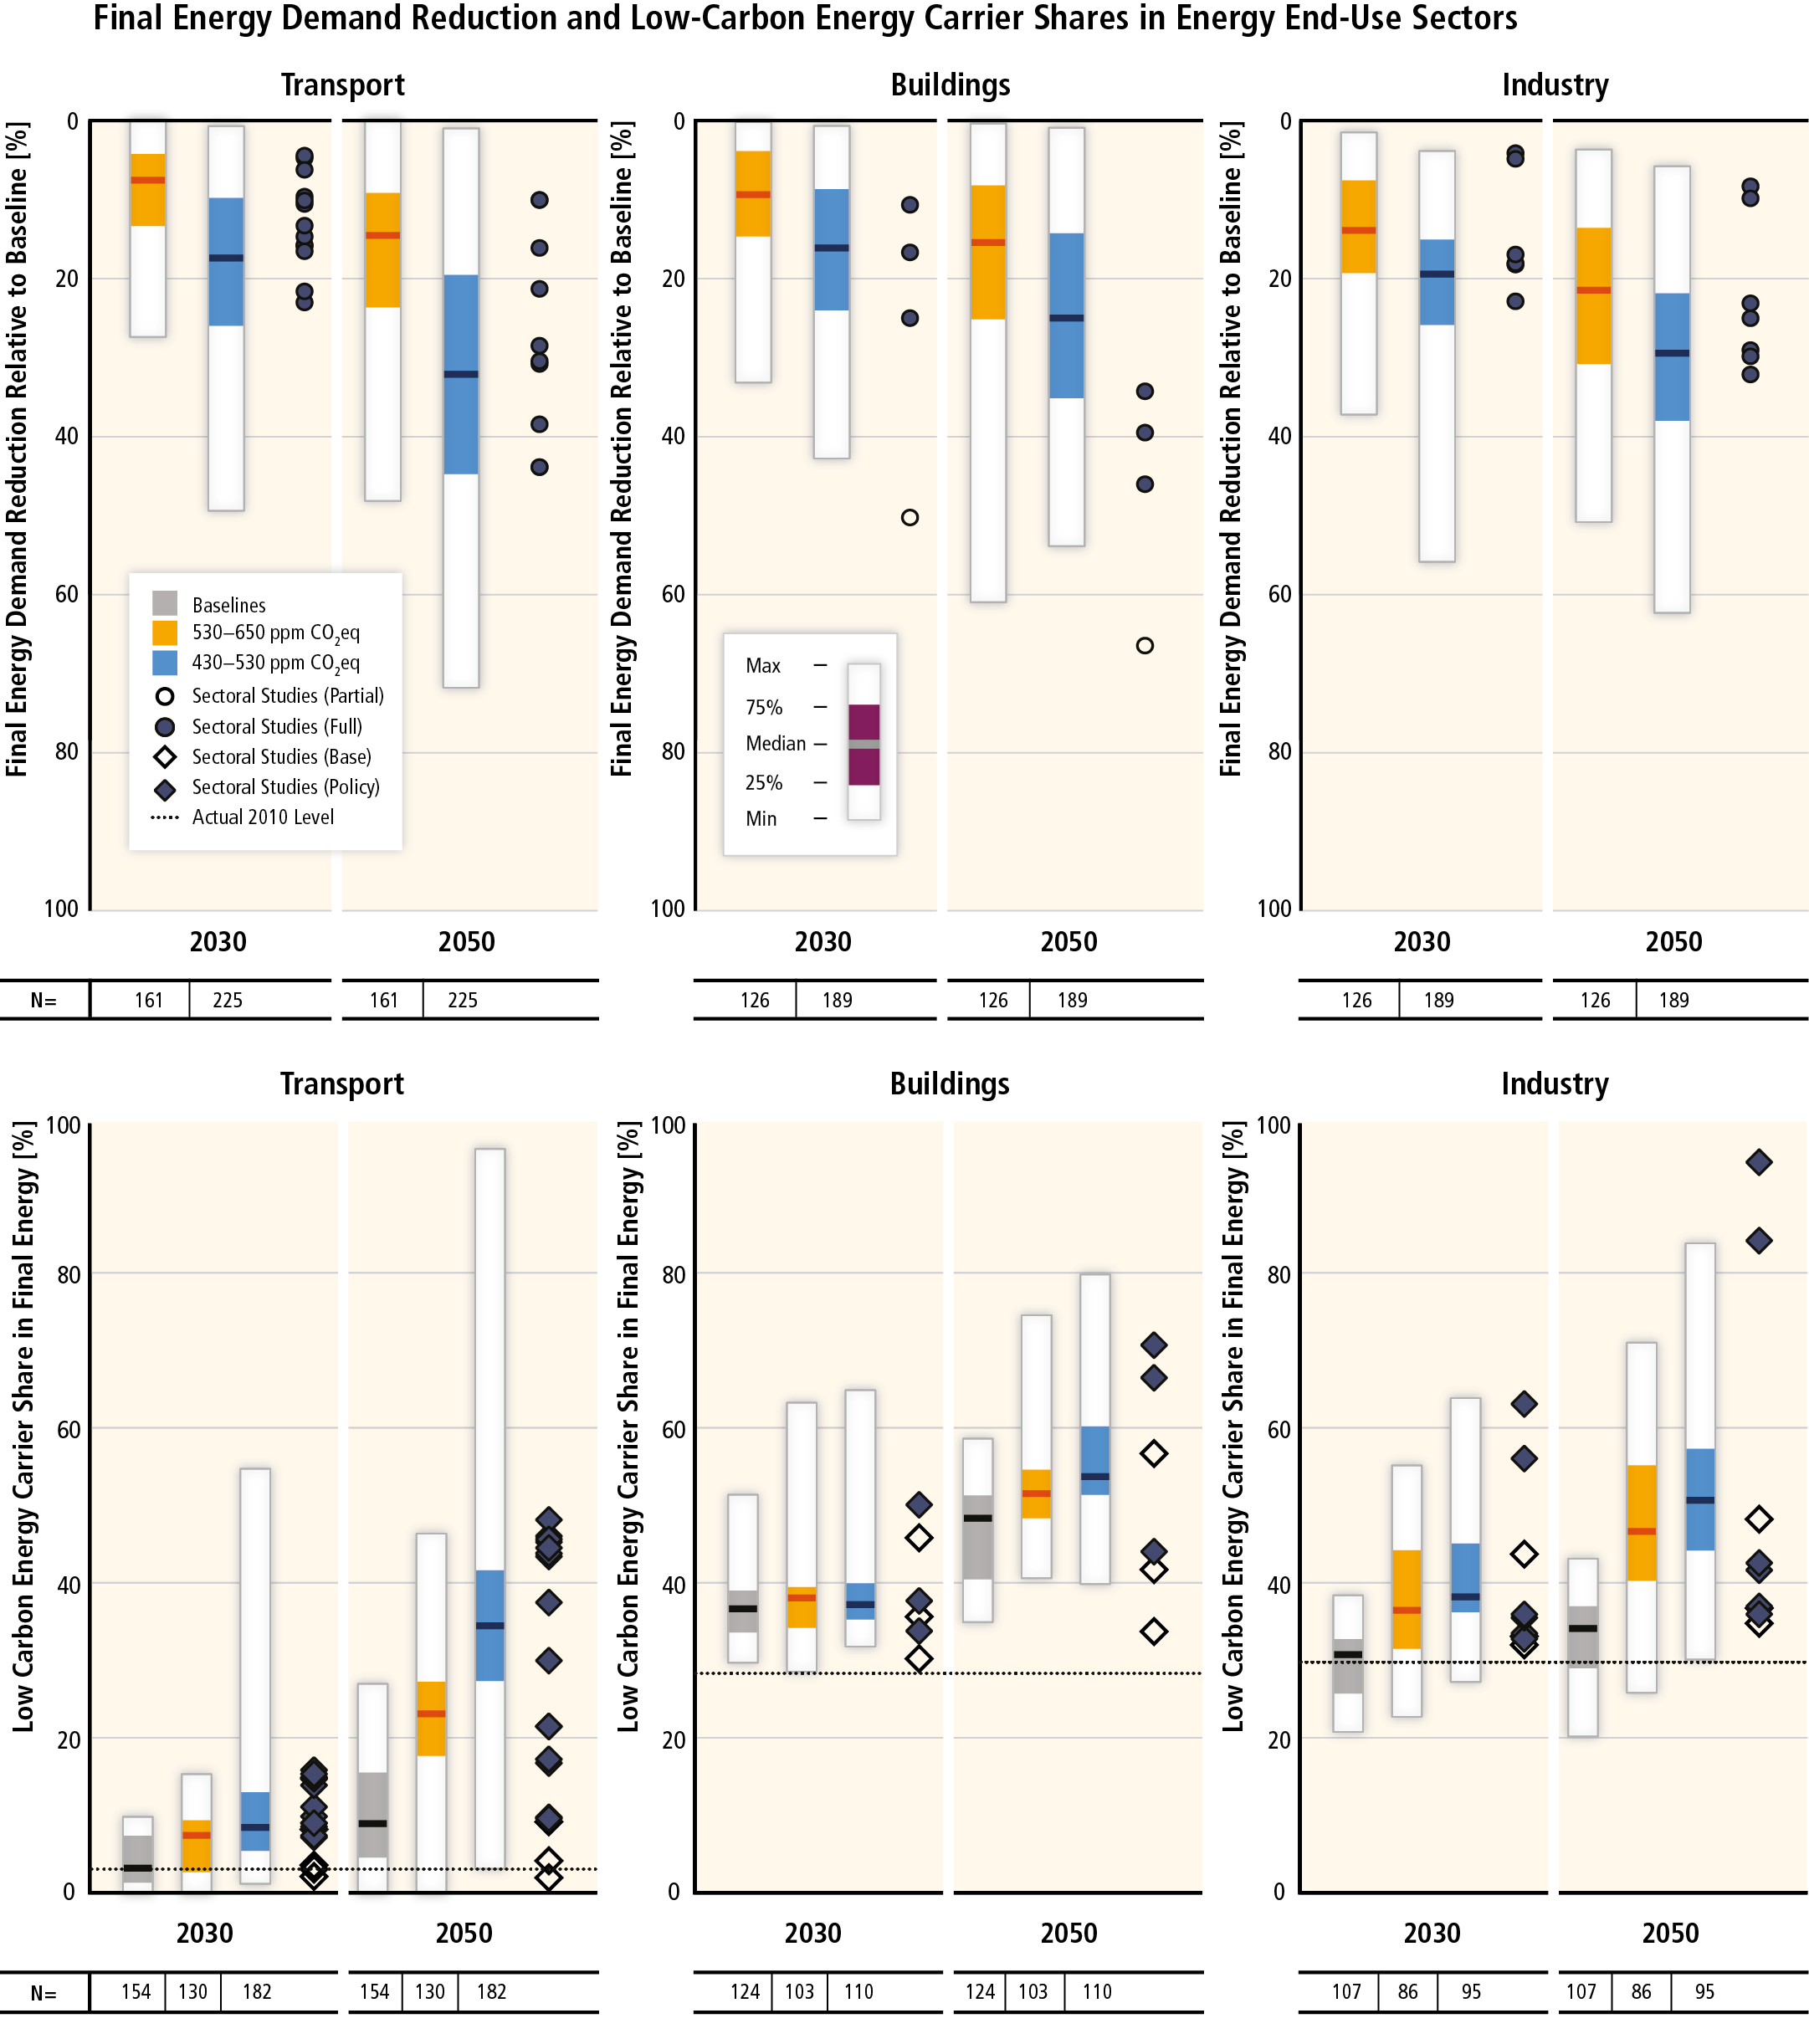
Figure SPM.8.
Download PDF (vector)
Final energy demand reduction relative to baseline (upper row) and low-carbon energy carrier shares in final energy (lower row) in the transport, buildings, and industry sectors by 2030 and 2050 in scenarios from two different CO2eq concentration categories compared to sectoral studies assessed in Chapters 8-10. The demand reductions shown by these scenarios do not compromise development. Low-carbon energy carriers include electricity, hydrogen and liquid biofuels in transport, electricity in buildings and electricity, heat, hydrogen and bioenergy in industry. The numbers at the bottom of the graphs refer to the number of scenarios included in the ranges which differ across sectors and time due to different sectoral resolution and time horizon of models. [Figures 6.37 and 6.38] [Subject to final quality check and copy edit.]
|
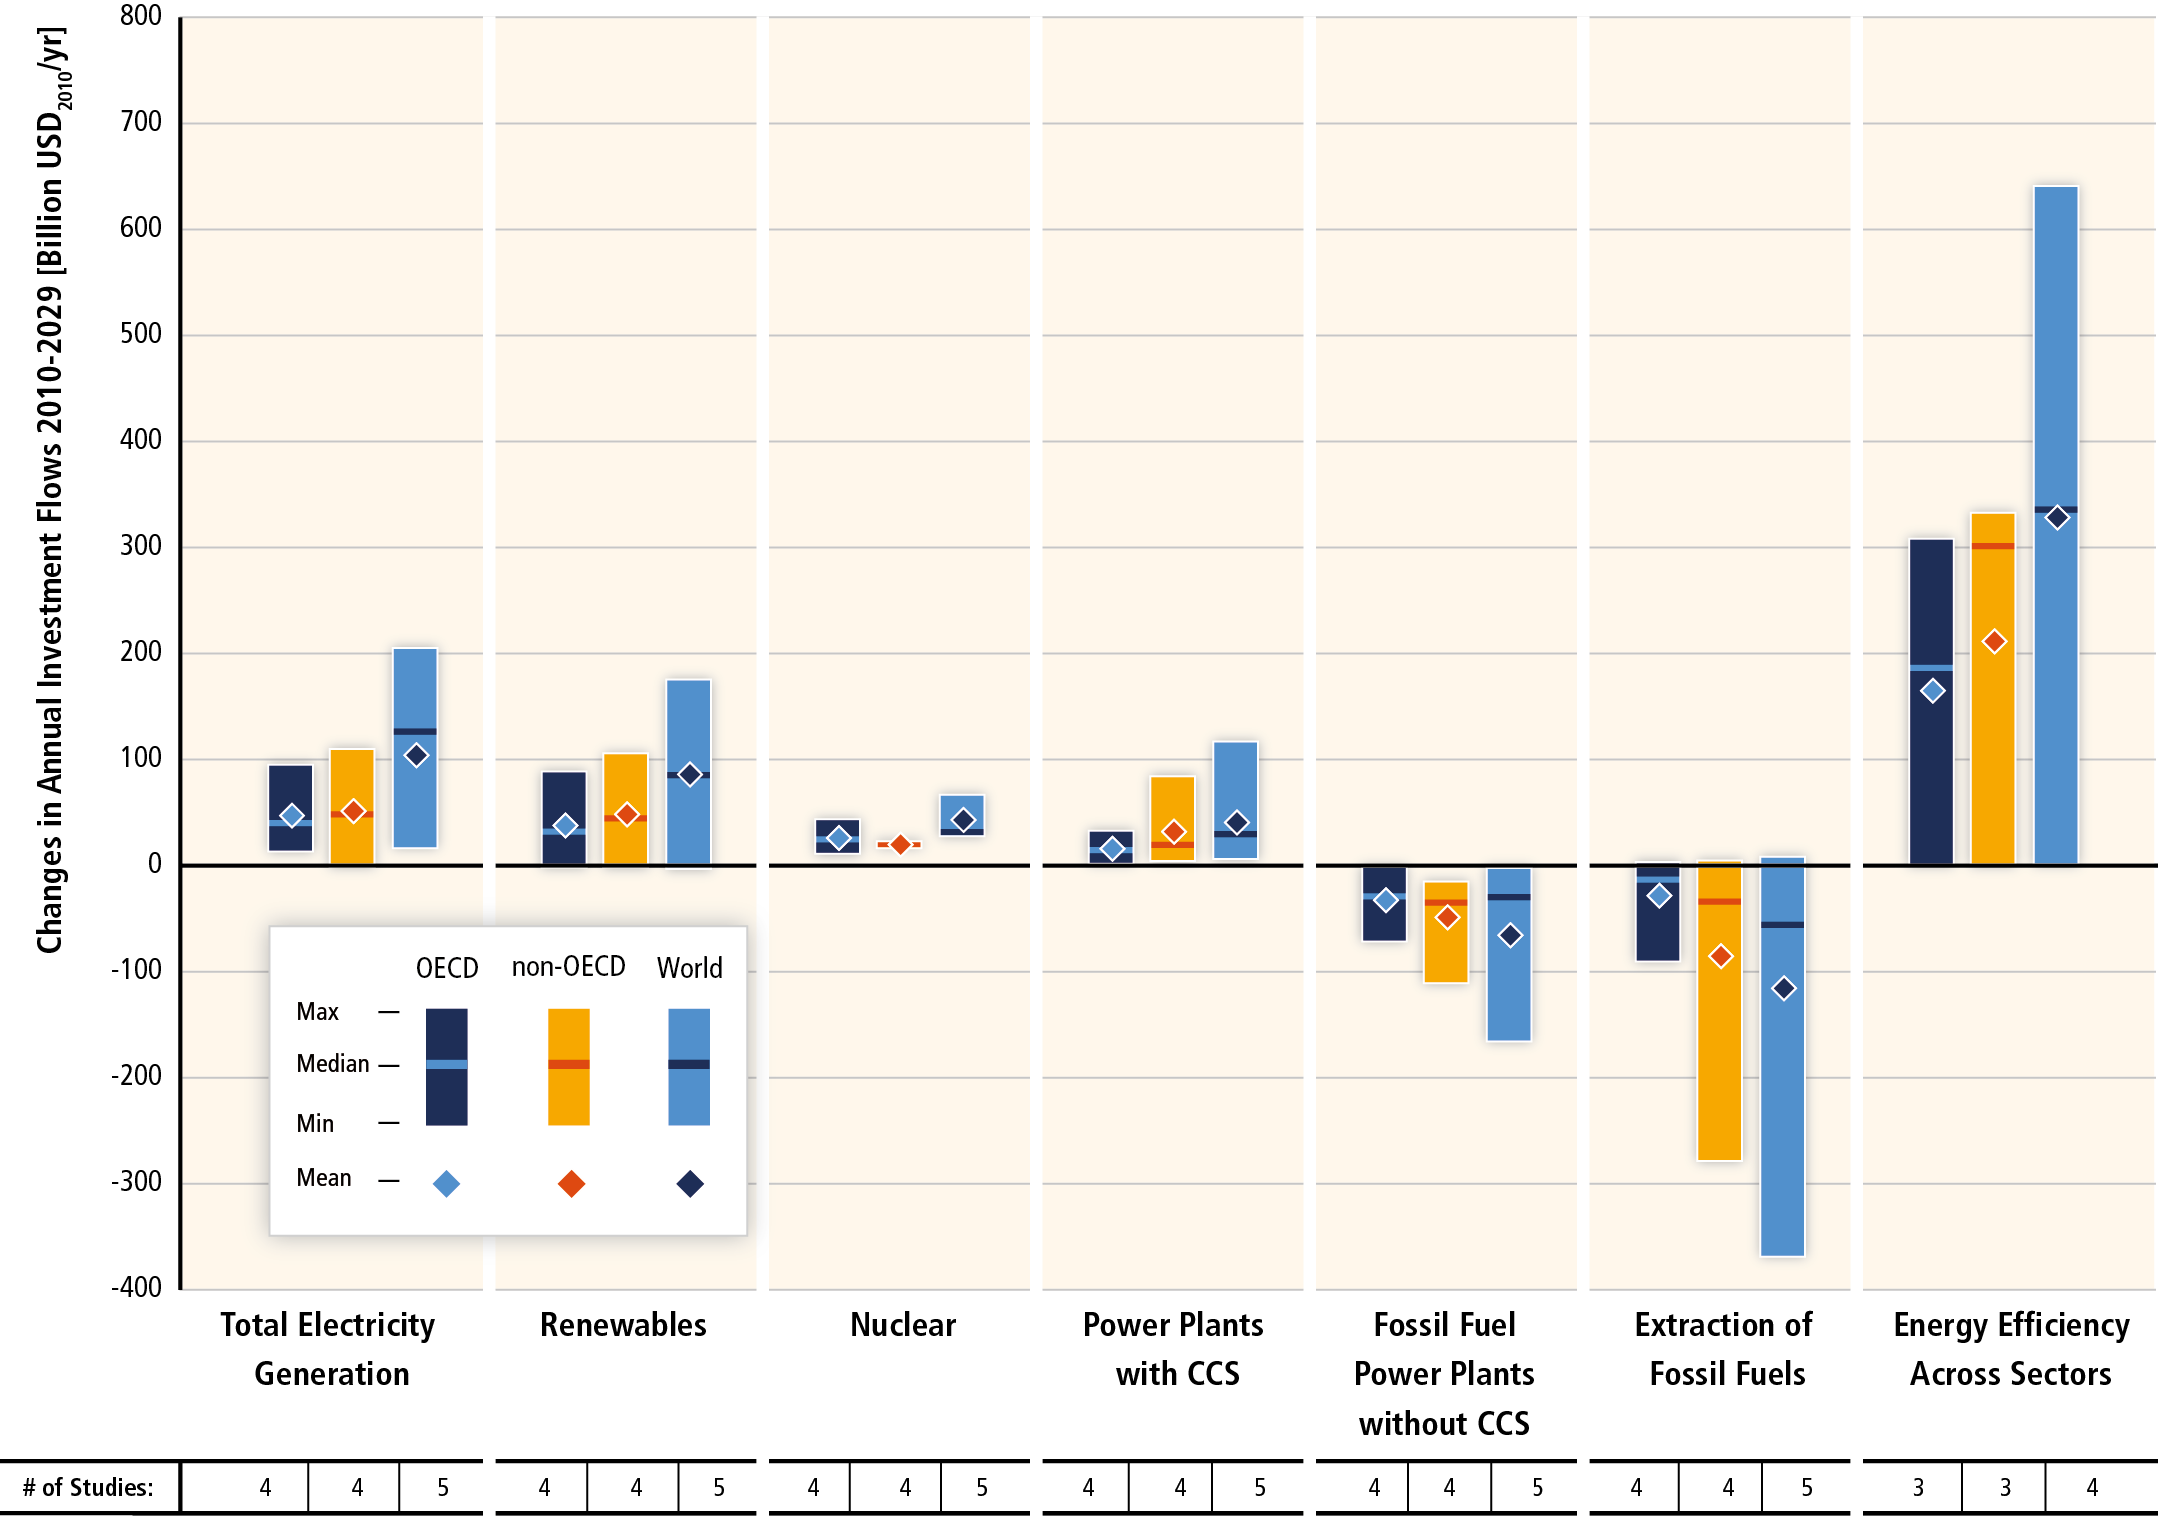
Figure SPM.9.
Download PDF (vector)
Change in annual investment flows from the average baseline level over the next two decades (2010 to 2029) for mitigation scenarios that stabilize concentrations within the range of approximately 430–530 ppm CO2eq by 2100. Investment changes are based on a limited number of model studies and model comparisons. Total electricity generation (leftmost column) is the sum of renewables, nuclear, power plants with CCS and fossil power plants without CCS. The vertical bars indicate the range between minimum and maximum estimate; the horizontal bar indicates the median. Proximity to this median value does not imply higher likelihood because of the different degree of aggregation of model results, the low number of studies available and different assumptions in the different studies considered. The numbers in the bottom row show the total number of studies in the literature used for the assessment. This underscores that investment needs are still an evolving area of research that relatively few studies have examined. [Figure 16.3] [Subject to final quality check and copy edit]
|
Figure SPM.8. Final energy demand reduction relative to baseline (upper row) and low-carbon energy carrier shares in final energy (lower row) in the transport, buildings, and industry sectors by 2030 and 2050 in scenarios from two different CO2eq concentration categories compared to sectoral studies assessed in Chapters 8-10. The demand reductions shown by these scenarios do not compromise development. Low-carbon energy carriers include electricity, hydrogen and liquid biofuels in transport, electricity in buildings and electricity, heat, hydrogen and bioenergy in industry. The numbers at the bottom of the graphs refer to the number of scenarios included in the ranges which differ across sectors and time due to different sectoral resolution and time horizon of models. [Figures 6.37 and 6.38] [Subject to final quality check and copy edit.]


